3.2 Agricultural, Forestry, and Fisheries
Geography of Korea: III. Production and Consumer Space > 2. Agriculture, Fisheries, and Forestry: Shrinking Industries Witnessing a Rebound
2. Agriculture, Fisheries, and Forestry: Shrinking Industries Witnessing a Rebound
In 1960, eight out of every ten Koreans lived in a rural environment. By 2010, not even one in ten Koreans did so. A mere fifty years ago rural Korea was the center of the country’s primary industries, among which farming was the most important. With the process of industrialization resulting from the state-led policy of industrial development from the 1960s, the share of the farming, fisheries, and forestry industries in the national economy became increasingly small, together accounting for only 2.4 percent of the national economy by 2011. Of this, farming accounted for 80.6 percent, forestry 3.6 percent, and fisheries 15.7 percent.
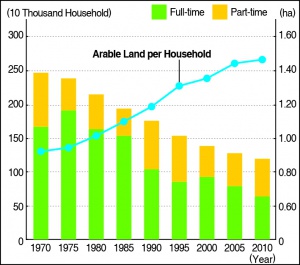
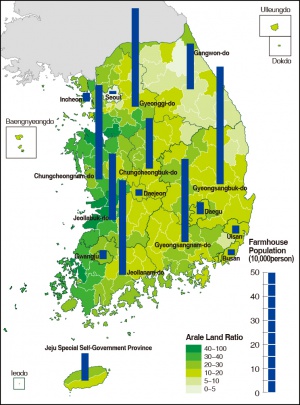
As of 2012, South Korea’s agricultural industry was made up of 1,151,000 households and engaged a population of 2,912,000 people; the forestry industry included 98,000 households and 248,000 people, while fisheries involved 61,000 households and 153,000 people. Compared to households nationwide, the size of households involved in the agricultural, forestry, or fisheries industries have shown a more rapid downward trend. Two-person households, the most predominant household size, account for 25.2 percent of households nationwide, but make up 48.9 percent of agricultural households, 51.9 percent of fisheries households, and 52.9 percent forestry households. Though the large proportion of two-person households in the agricultural, forestry, and fisheries industries reflects the overall aging of the South Korean population, compared to the nationwide percentage of elderly (11.8%), elderly make up 35.6 percent of the agricultural population, 27.8 percent of the fisheries population, and 34.1 percent of the forestry population. All agricultural, forestry, and fisheries households are seeing a decline, and the agricultural sector will continue to experience a decline in both full- and part-time farmers. As of 2010, approximately 625,000 farming households (54.3%) were engaged in farming full-time, while 525,000 (45.7%) were part-time. Though arable land has been reduced through urbanization and industrialization, a more rapid trend has been the increase in cultivated land being worked per household as a result of the overall decline in farming households. Looking at a map of cultivated farmland, one sees the majority is found in the country’s hinterland. In terms of the number of farming households by province, Gyeongsangbuk-do leads with 196,000 (17%), followed by Jeollanam-do with 164,000 (14.3%) and Chungcheongnam-do with 147,000 (12.8%).
In terms of amount of arable land, about 750,000 farming households (65.2%) cultivate 1 hectare or less, 99,000 households (8.6%) cultivate over 3 hectares, while large-scale farming (cultivating over 3 hectares) is on the rise. But due to the aging of the rural population and the concomitant decrease in the young and middle-age population, the rate of arable land utilization is also seeing a decline.
The two aspects of the forestry industry are the forested land itself and the forestry households connected to its cultivation. In terms of South Korea’s forested land area, as with the country’s arable land, though it has witnessed a gradual reduction in the face of the twin forces of industrialization and urbanization, this has also meant a great concentration and total amount of harvestable wood relative to area. Forestry households can be subdivided into those involved in forest cultivation and those that are not. The large majority are cultivating households—accounting for some 86,000, or 88 percent, of the total forestry households. Among these, the highest percentage are those involved in the cultivation of astringent persimmons (29.7%), followed by wild edible greens—what Koreans call sannamul (18.3%), ornamental plants or horticulture (18.1%), medicinal plants (17.2%), and chestnuts (16.0%). As for non-cultivating households, the highest percentage (9.4%) are involved in forest gathering activities, followed by forestry industries (9.4%) and logging and nurseries (1.2%), and among forest gathering households, the highest percentage (60.2%) are involved in the harvesting of mushrooms, followed by tree sap (14.6%), and bracken, or gosari (13.9%). Though as of 2012, the number of forestry households was insignificant, the industry has seen some slight growth due to a growing consumer demand for natural and health-promoting products.
Korea’s fishery industry is a natural outgrowth of its geographic setting, surrounded as it is by sea on three sides. In terms of region, Jeollanam-do province has the highest percentage share of the country’s fishery households at 22,000 (35.1%), followed by Gyeongsangnam-do with 9800 (15.9%), and Chungcheongnam-do with 9500 (15.5%). Of the country’s total fishery households, about 19,000 (30.2%) are full-time, while some 43,000 (69.8%) are part-time. The number of fishing households is in decline, a result of the aging of the population, the depletion of fish populations, and the loss of coastal fishing grounds due to land reclamation. The number of fishery households involved in a type of fishing that utilizes a fishing vessel is 27,000 (or 43.3%), while about 18,000 households (29.3%) do not use a fishing vessel for their work, and 17,000 households (27.3%) are involved in fish farming. About 46.8 percent the country’s total fish production comes from shallow coastal farming, followed by 34.3 percent from deep-sea fishing, 18.1 percent from coastal sea fishing, and 0.9 percent from inland fishing. Until 2005 deep-sea fishing was the largest producer, but was overtaken by coastal farming after this date. The origins of this change go back to the early 1990s with a shift in government policy towards fish farming and away from trawling. From 1998, with the entry into force of the Korean-Japanese Fisheries Agreement, fishing rights were curtailed and there was a resulting drop in the number of fishery households, while government efforts at buying back offshore fisheries also resulted in an increase in the number of household abandoning sea fishing. Looking at the average household capital investment required by fishing type—under ten million Korean won ($US9000) for fishing without a vessel, between ten and a hundred million Korean won ($US9000-90,000) for fishing with a vessel, and over one hundred million Korean won ($US90,000) for fish farming or aquaculture—gives us an idea of relative production output for each of these types. The primary types of sea life harvested by Korean fisheries are, for aquaculture, shellfish (60.5%) and seaweed varieties (25.1%); for coastal fishing, various varieties of fish (31.7%) and crustaceans (31.3%), and in deep-sea fishing, such varieties as tuna, whiting, and pike; and for inland fishing, eels and freshwater clam dominate. In terms of markets for Korean maritime products, the majority of such products (36.6%) are sold to the National Confederation of Fisheries Cooperatives (Susaneop hyeopdong johap), followed by direct sales to dealers in sea products (28.5%), direct sales to consumers (18.1%), and restaurants (5.8%).
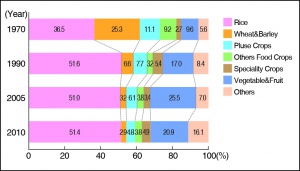
Rural Korea has undergone fundamental change as a result of industrialization and urbanization, but in contrast to the drop in full-time farming households, the country is witnessing a rise in part-time farming households, while another distinguishing feature of agriculture in today’s Korea is the diversification and commercialization of agriculture, as seen in the increase of corporate agriculture and commissioned agricultural companies, which are expanding the scale of farming, and the relative rise in cash crops and away from former staples.
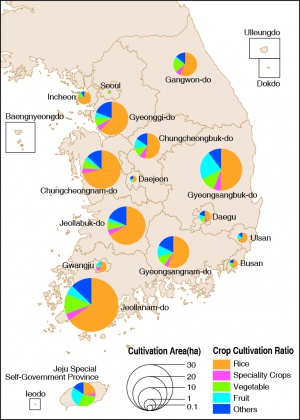
Looking at cultivation by crop type, the staple rice is more widely cultivated relative to other crops, and in more temperate and flatter Jeollanam-do and Jeollabuk-do provinces its cultivation is particular high. However, in recent years the country’s widespread rice cultivation has seen a drop due to the opening of the country’s market and a decrease in consumer demand. Due to drops in consumer demand and profitability, the extent of double-cropping with barley in between rice crops has also fallen off. Barley cultivation is relatively high in Jeollanam-do, Jeollabuk-do, and Gyeongsangnam-do provinces. As national living standards have risen so has demand for fruits and vegetables, resulting in increased acreage dedicated cash crops, such as fruits and vegetables. Compared to other areas of the country, the cultivation of fruit crops is relatively high in Gyeongsangbuk-do and Jeju-do provinces.
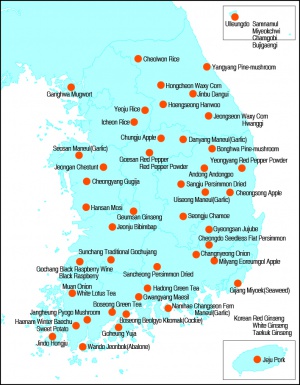
The World Trade Organization and Free Trade Agreements have worked to accelerate the opening of Korea’s agricultural markets and weakened the price competitiveness of Korean agricultural products. In response to this, there is a need to strengthen competitiveness though such measures as adopting more scientific agricultural management practices, focusing on high-end products, and cultivating eco-friendly, organic produce. Currently, the share of agricultural in the national economy is waning, and to strengthen the competitiveness of the agricultural industry efforts are being made in such areas as increasing brand identity, improving product sophistication and quality, and producing agricultural products that promote healthy lifestyles. Because sales are so critical, a strategy has been implemented to indicate products by geographical region of origin in order to both differentiate them and raise their profile. This strategy promotes regional specialty products, such as rice, apples, or green tea, by reflecting the special climatic, topographical, and soil characteristics of different regions. Such geographically indicated products range from Boseong green tea (officially recognized as the number 1 protected geographical indication by the Korean government), to Seongju melons, and Danyang garlic. Further, these regions have inaugurated festivals to highlight their local specialties and the distinctive characteristics of the region.
Environmentally friendly agriculture emerged to meet the varied needs of consumers arising out of improved standards of living and in an effort to differentiate domestic agricultural products from imported ones through the cultivation of high-quality crops through organic farming. With Korea’s rapid economic growth of the last forty years, the country’s rural areas have suffered a large population drain as residents migrated to urban areas. However, since the mid-2000s, with economic recession and a growing population of retiring baby boomers, the country’s rural regions and farming are witnessing a steady growth in population. Whereas the country had some 880 households return to rural residency and agriculture in 2001, this number grew gradually to 10,503 returning households by 2011, only to double again in the course of a single year to some 27,000 households in 2012. This resurgence of the rural population is made up of retired professionals and office workers realizing their dreams of taking up country life, while the mainstream is composed of younger people taking up farming for the first time, all of which is serving to both invigorate the rural economy and at the same time to infuse it with a new vitality as a result of a migrant younger population. Yet another ingredient in the mix are young foreign brides for rural residents, a factor that is also serving to revitalize Korea’s rural regions.
